User Interface
Specification for AP STAT
(Zx181)
For Clemson University
Tomoaki Satoh
CASIO COMPUTER CO.,LTD
**************************************************
June 21,1999 : release Ver.A
July 29,1999 : release Ver.B
(I used blue words
for the point of adding or changing)
1. Introduction.
We develop AP STAT application (Zx181) as the
add-in software for FX 2.0. When this software installed into FX 2.0,
no new icon appears. STAT application in FX 2.0 is overwrited to AP
STAT by installing software (note: icon design is
kept). So after installing AP STAT, user can find AP STAT
functionality in STAT icon.
CASIO explain the following point of
specification for AP STAT in this document.
- Common
Feature
- TEST specification
- INTERVAL Specification
- DISTRIBUTION specification
- Additional
specification
- Operation procedure
After installing AP STAT, user can perform
the original STAT feature.
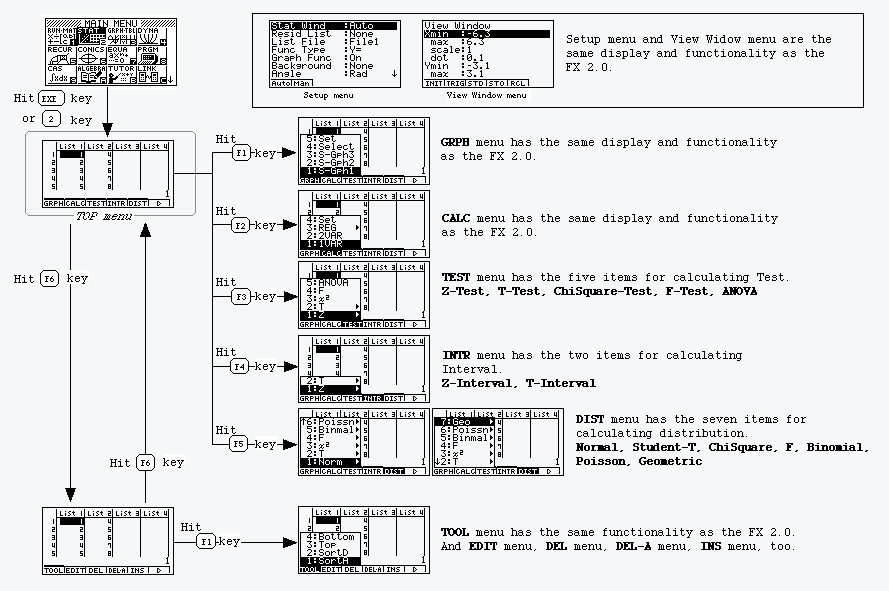
** Operation Procedure **
TOP
screen.gif
2. Common Features.
Calculation Execution Indicator
Whenever the calculator is busy drawing a
graph or executing a long calculation, a black box flashed in the
upper right corner of the display.
NOTE : It
is CASIO's job to display this indicator.
AC Break
Whenever the calculator is busy drawing a
graph or executing a long calculation (it spend time more than two
minutes for performing), if user hit [AC] key, then a AC Break dialog
box appeared in the center of the display, and stopped drawing or
executing calculation.
NOTE : It
is both CASIO and Clemson job to include check flow into calculation
code.
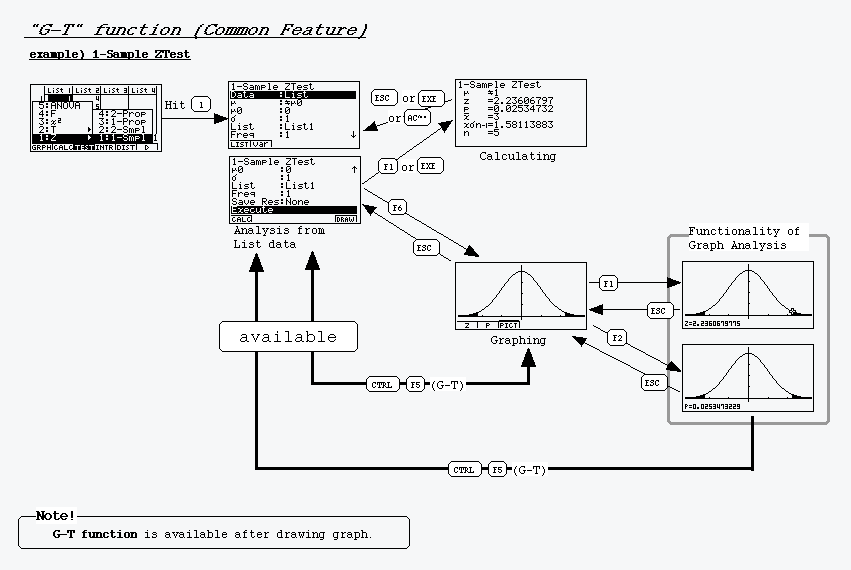
G-T
Whenever the calculator has drawn a graph, if
user hit [CTRL][F6] key during a display of graph, then display
changed between 'graph display' and 'text display'.
NOTE : It
is CASIO's job to include working flow.
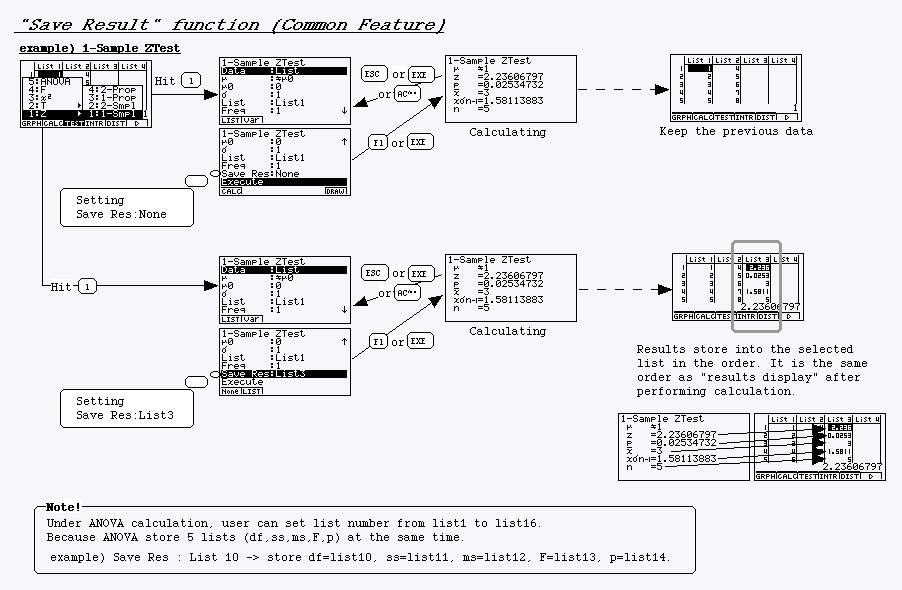
Save Result functionality
To store the result of calculation in the
order into selected list. It is the same order as 'results display'
after performing calculation.
NOTE : It
is CASIO's job to include working flow.
** Operation Procedure **
G-T.gif
Save
Result.gif
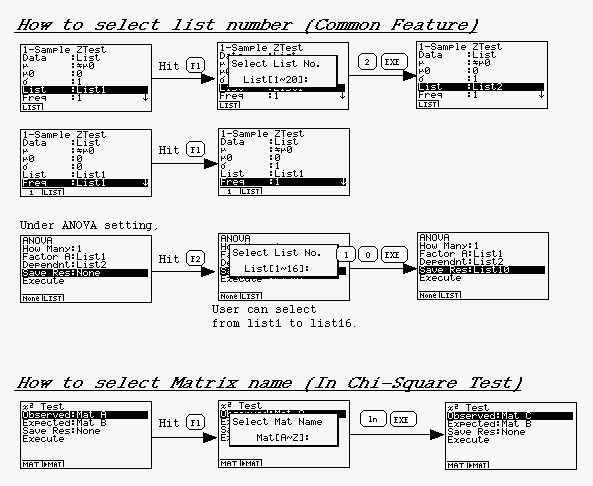
How to
select.gif
3. TEST Specification.
AP STAT has the following functionality under
TEST
menu.
|
Bottom menu
|
Second menu
|
Third menu
|
Functionality
|
|
TEST
|
Z
|
1-Smpl
|
1-Sample ZTest
|
|
|
|
2-Smpl
|
2-Sample ZTest
|
|
|
|
1-Prop
|
1-Proportional ZTest
|
|
|
|
2-Prop
|
2-Proportional ZTest
|
|
|
T
|
1-Smpl
|
1-Sample tTest
|
|
|
|
2-Smpl
|
2-Sample tTest
|
|
|
|
LinReg
|
Linear Regression tTest
|
|
|
X2
|
-
|
Chi-Square Test
|
|
|
F
|
-
|
2-Sample FTest
|
|
|
ANOVA
|
-
|
ANOVA
|
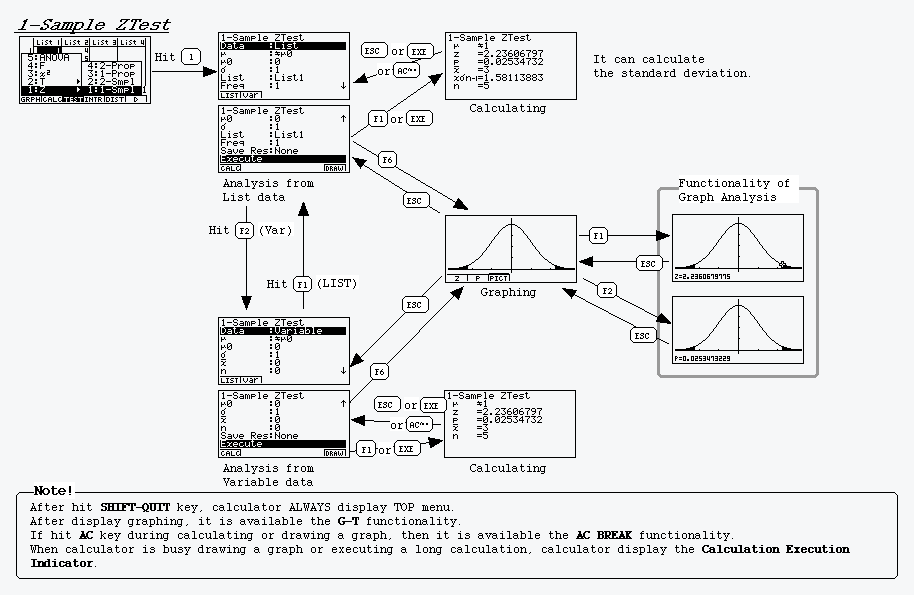
1-Sample ZTest
- User can choose list data or variable
data for input.
- User can choose a population mean value
test conditions as input.
- When selected list into 'Data Type'
setting, the calculator has to compute sample mean and sample size
and standard deviation from list data before main calculating.
- Perform calculation (Z-score, p-value,
sample mean, sample standard deviation (only selected list into
'Data Type' setting), sample size) or drawing a graph.
- Perform graph analysis (Z-score,
p-value).
** Operation Procedure **
1-Sample
ZTest.gif
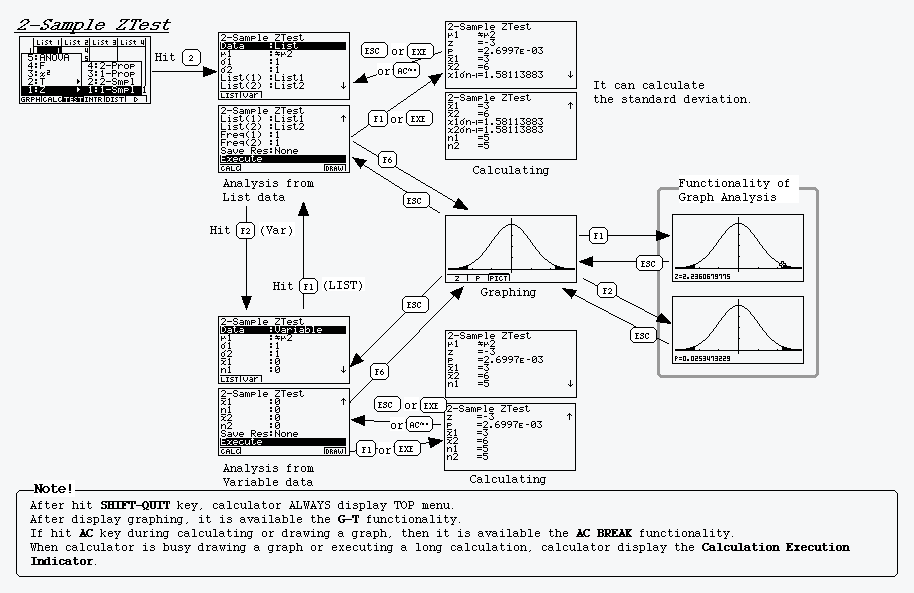
2-Sample ZTest
- User can choose list data or variable
data for input.
- User can choose a population mean value
test conditions as input.
- When selected list into 'Data Type'
setting, the calculator has to compute sample mean and sample and
standard deviation from list data (data1 and data2) before main
calculating.
- Perform calculation (Z-score, p-value,
sample mean (data1 and data 2), sample standard deviation (data1
and data2 / only selected list into 'Data Type' setting), sample
size (data1 and data2)) or drawing a graph.
- Perform graph analysis (Z-score,
p-value).
** Operation Procedure **
2-Sample
ZTest.gif
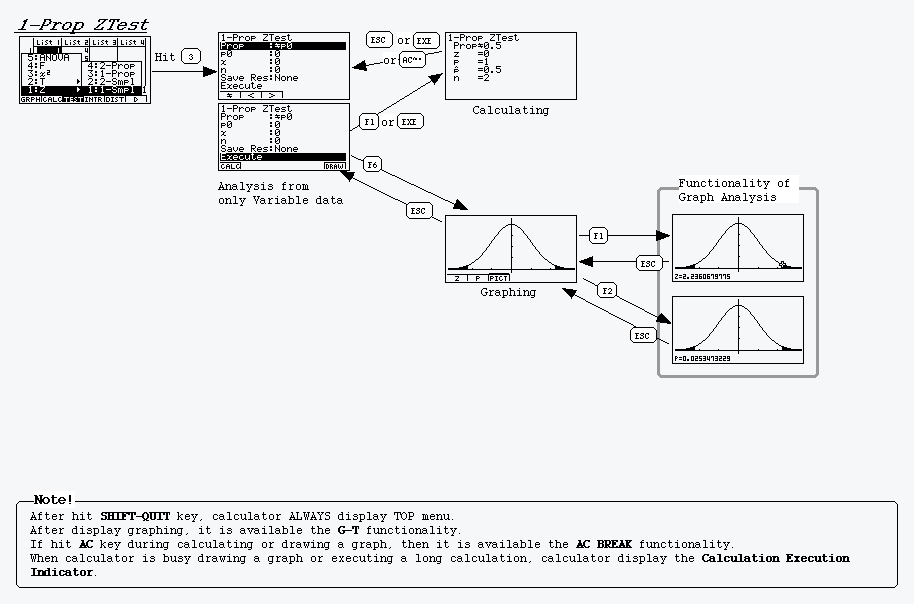
1-Proportional
ZTest
- Variable data for input.
- User can choose a sample proportion test
conditions as input.
- Perform calculation (Z-score, p-value,
estimated sample proportion, sample size) or drawing a graph.
- Perform graph analysis (Z-score,
p-value).
** Operation Procedure **
1-Prop
ZTest.gif
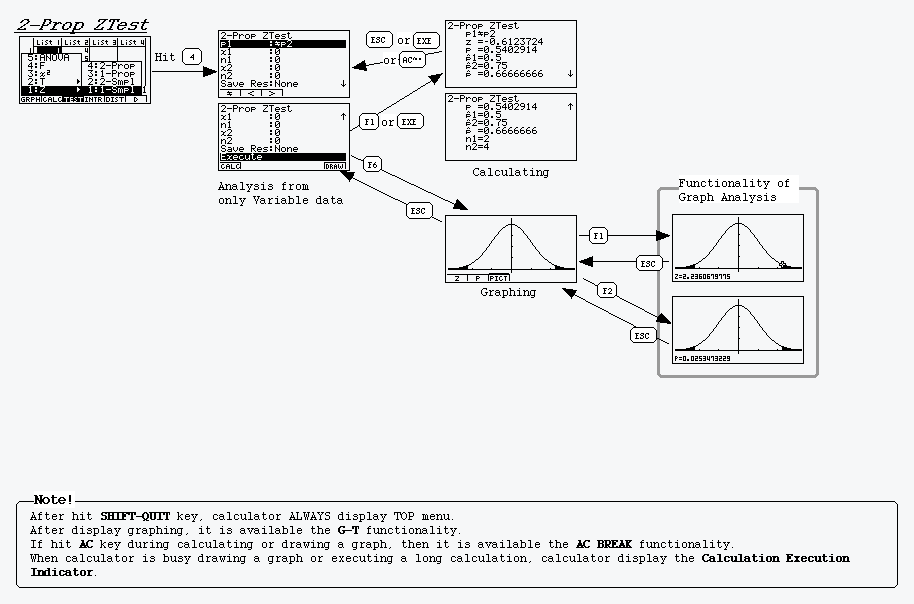
2-Proportional
ZTest
- Variable data for input.
- User can choose a sample proportion test
conditions as input.
- Perform calculation (Z-score, p-value,
estimated proportion of population (data1 and data2), estimated
sample proportion, sample size (data1 and data2)) or drawing a
graph.
- Perform graph analysis (Z-score,
p-value).
** Operation Procedure **
2-Prop
ZTest.gif
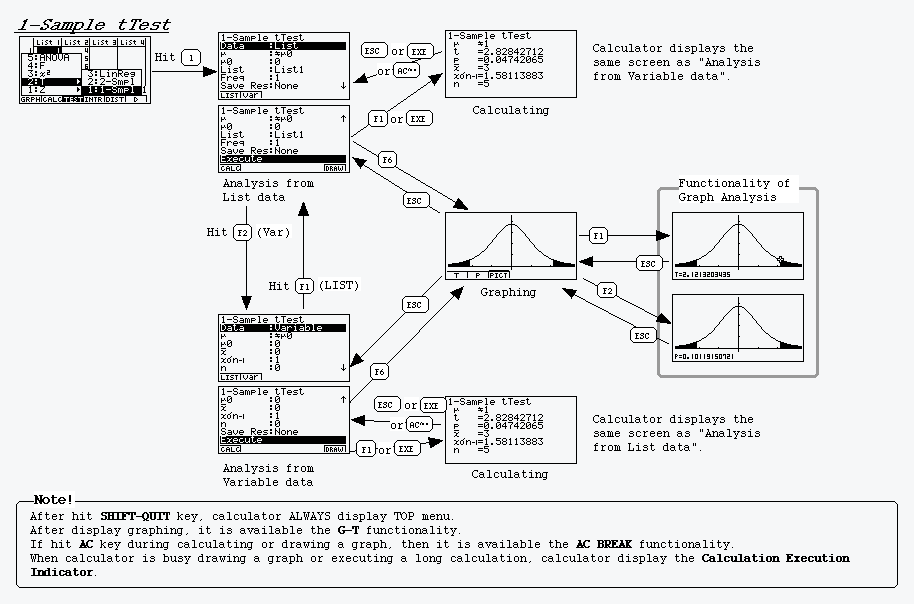
1-Sample tTest
- User can choose list data or variable
data for input.
- User can choose a population mean value
test conditions as input.
- When selected list into 'Data Type'
setting, the calculator has to compute sample mean and sample size
and standard deviation from list data before main calculating.
- Perform calculation (t-value, p-value,
sample mean, sample standard deviation, sample size) or drawing a
graph.
- Perform graph analysis (t-value,
p-value).
** Operation Procedure **
1-Sample
tTest.gif
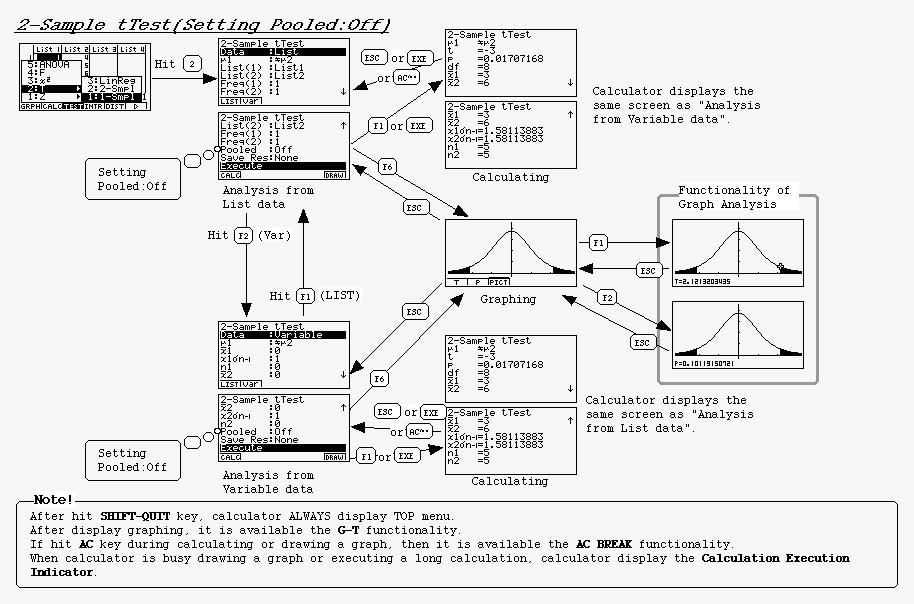
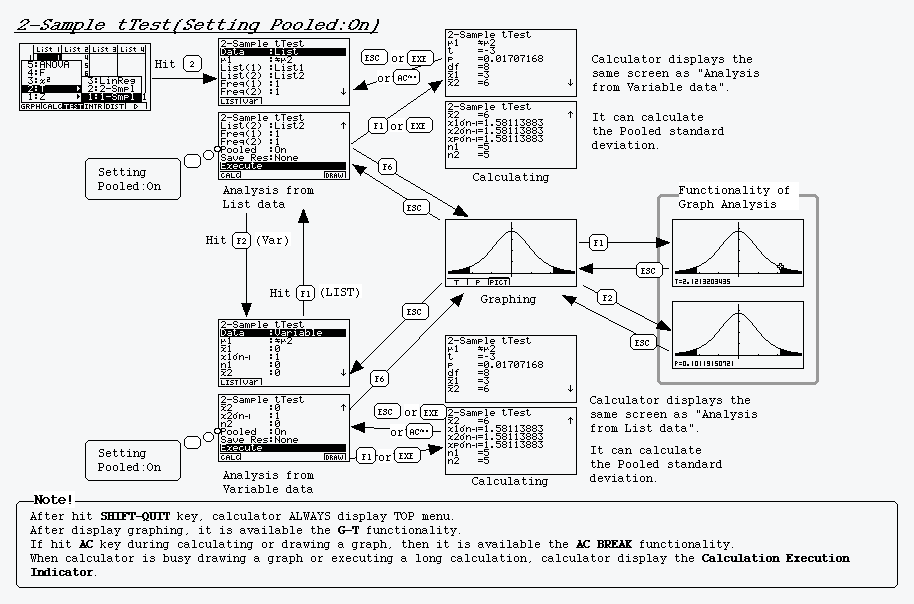
2-Sample tTest
- User can choose list data or variable
data for input.
- User can choose a sample mean value test
conditions as input.
- When selected list into 'Data Type'
setting, the calculator has to compute sample mean and sample size
and standard deviation from list data (data1 and data2) before
main calculating.
- Perform calculation (t-value, p-value,
degrees of freedom, sample mean (data1 and data 2), sample
standard deviation (data1 and data2), sample size (data1 and
data2)) or drawing a graph.
- When selected pooled:on into 'pooled'
setting before user calculates, calculator has to compute in
executing and display a pooled sample standard deviation.
- Perform graph analysis (t-value,
p-value).
** Operation Procedure **
2-Sample
tTest.gif
2-Sample
tTest.gif
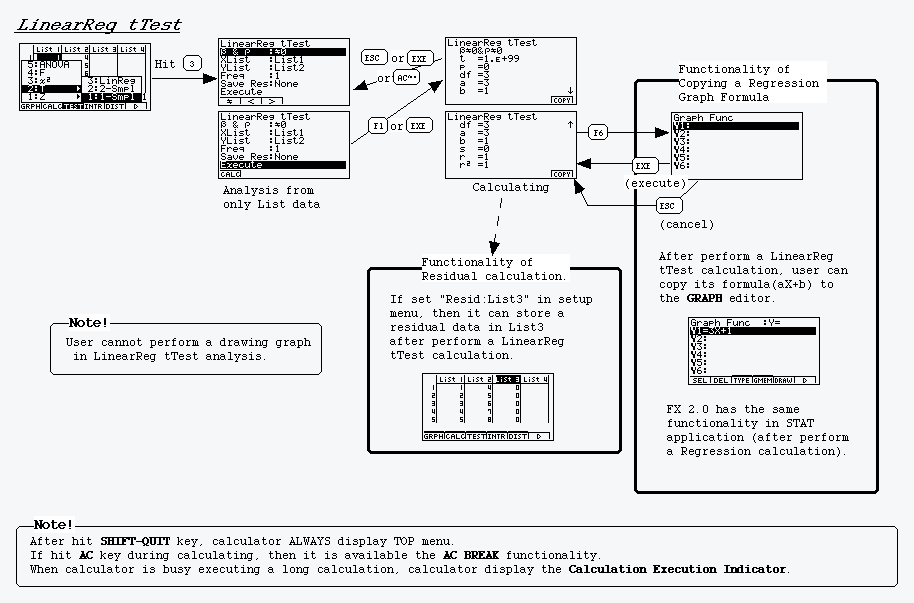
Linear Regression
tTest
- List data for input.
- User can choose a p-value test conditions
as input.
- Perform calculation (t-value, p-value,
degrees of freedom, contrast term, coefficient, standard error,
correlation coefficient, coefficient of determination).
- Do not perform a drawing graph
- Hit [F6] key when display result, user
can be used to copy the regression formula into GRAPH function
editor.
- Selected Resid:List (number) into 'Resid
List' setting before calculation, calculator has to compute
residuals, and calculator has to store the residuals into selected
list before display result.
** Operation Procedure **
LinReg.gif
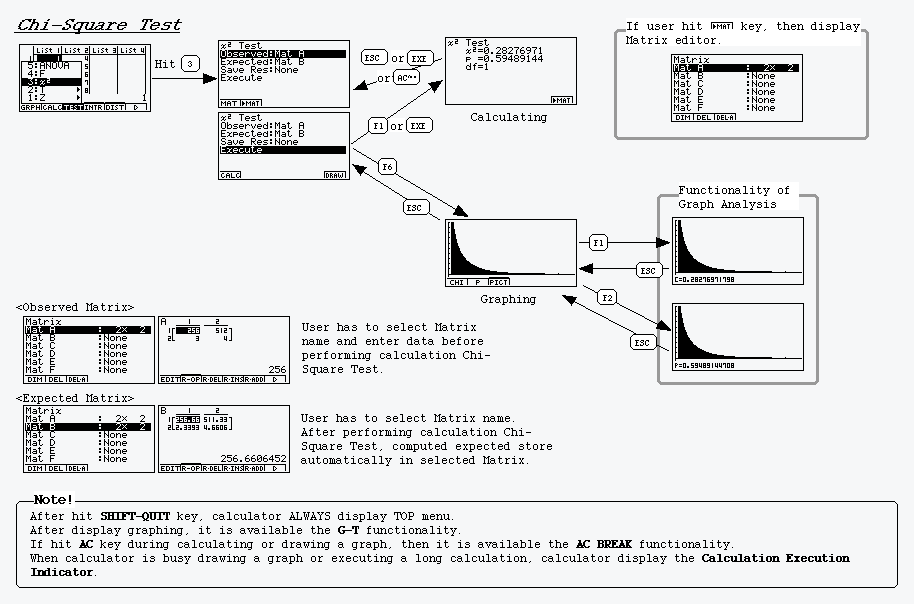
Chi-Square Test
- Matrix stored observed data has to be
selected by user before calculation.
- Matrix in which user wants to store data
as expected data has to be selected by user before
calculation.
- User can access to Matrix
editor from chi-square test display of setting.
- Perform calculation (chi-square-value,
p-value, degrees of freedom, expected values (only stored into
selected matrix)) or drawing a graph.
- User can access to Matrix
editor from chi-square test display of result.
- Perform graph analysis (chi-square-value,
p-value).
** Operation Procedure **
Chi-Square
Test.gif
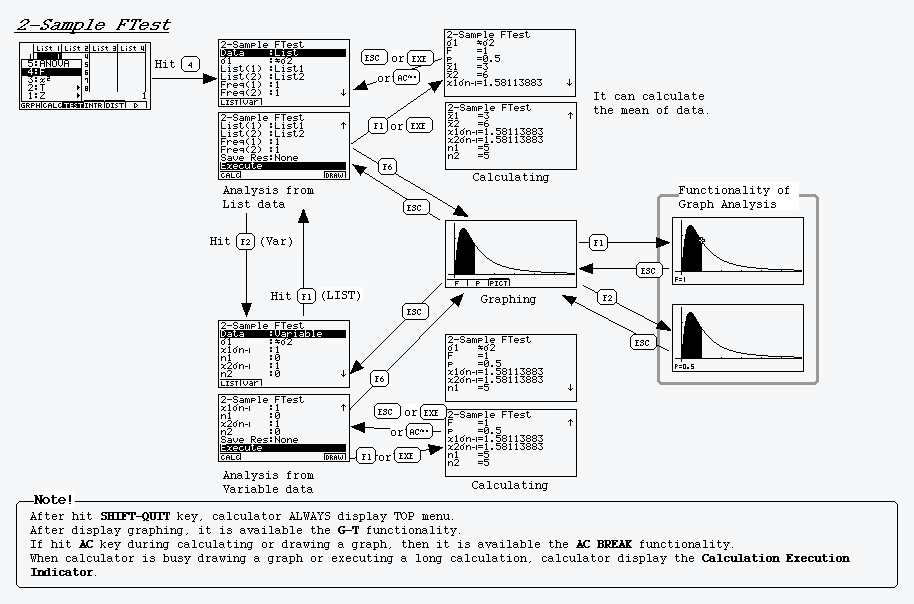
2-Sample FTest
- User can choose list data or variable
data for input.
- User can choose a population standard
deviation test conditions as input.
- When selected list into 'Data Type'
setting, the calculator has to compute sample mean and sample size
and standard deviation from list data (data1 and data2) before
main calculating.
- Perform calculation (F-value, p-value,
sample mean (from data1 and data2 / only selected list into 'Data
Type' setting), sample standard deviation (from data1 and data2),
sample size (from data1 and data2)) or drawing a graph.
- Perform graph analysis (F-value,
p-value).
** Operation Procedure **
2-Sample
FTest.gif
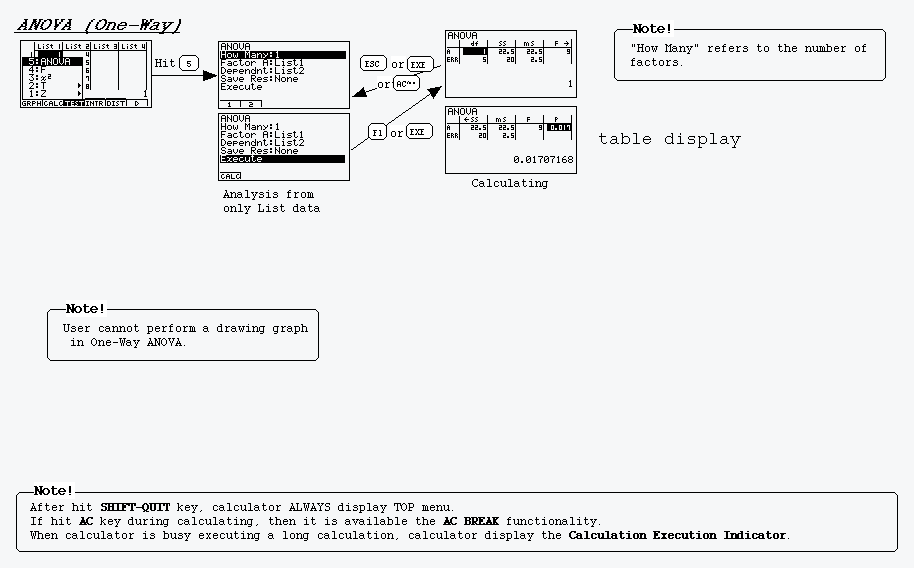
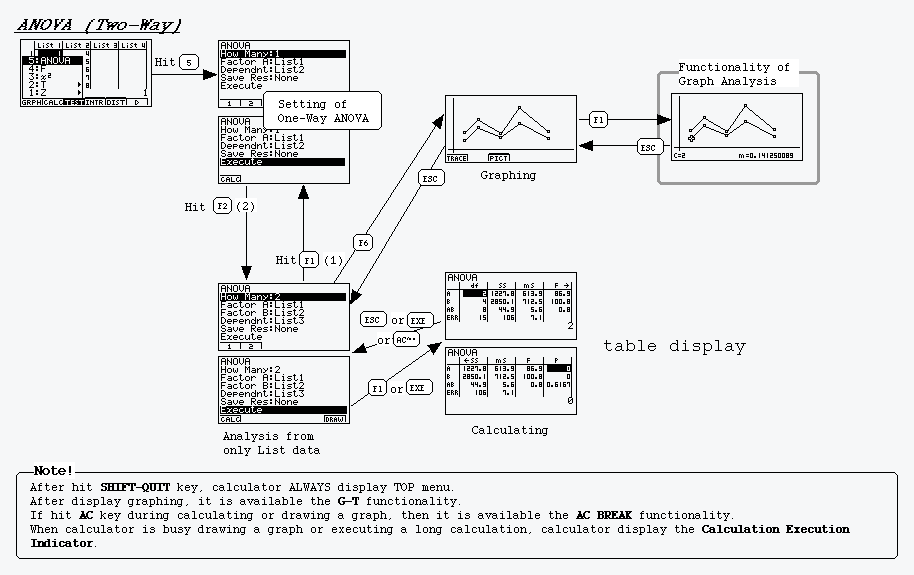
ANOVA
- AP STAT can perform both one-way ANOVA
and two-way ANOVA calculation.
- User can choose the number of factors
(from 'How many' setting) for input. If selected '1', then perform
one-way ANOVA calculation. If selected '2', then perform two-way
ANOVA calculation.
- User has to select list of Factor and
Dependent as input. List of factor consists of categorical
variables, and list of dependent consists of measurement
variables.
- Perform calculation under one-way ANOVA
(F-value, p-value, pooled sample standard deviation, factor
degrees of freedom, factor sum of squares, factor mean of squares,
error degrees of freedom, error sum of squares, error mean
squares).
- Display table style as
the result of one-way ANOVA.
- Under performing one-way ANOVA, do not
perform a drawing graph.
- Perform calculation under two-way ANOVA
(degrees of freedom (factor A, factor B, factor A * factor B,
error), sum of square (factor A, factor B, factor A * factor B,
error), mean square (factor A, factor B, factor A * factor B,
error), F-value (factor A, factor B, factor A * factor B), p-value
(factor A, factor B, factor A * factor B)), or drawing a graph
**
1.
- Display table style as
the result of two-way ANOVA.
- Selected Resid:List
(number) into 'Resid List' setting before calculation, calculator
has to compute residuals, and calculator has to store the
residuals into selected list before display result. This feature
can perform both one-way ANOVA and two-way ANOVA** 2.
- Include 'Interaction'
setting under two-way ANOVA setting.
Note : Now, CASIO
is confirming the following question to Clemson.
A : the result of
two-way ANOVA under setting 'Interaction : Yes'
B : the result
of two-way ANOVA under setting 'Interaction : No'
Is the
calculator has the difference of the result between A and B???
CASIO cannot fix
the user interface specification of two-way ANOVA completely until
CASIO can get confirmation or collect display of result from
Clemson.
Both CASIO and Clemson had
agreed to delete 'Iteration' setting.
-----------------------
**1 NOTE :
If
clemson agrees our idea that CASIO suggested to Clemson by the e-mail
'some fundtionality for AP STAT', then CASIO can realize this
functionality.
Clemson offers the(x,y) data to CASIO.
-----------------------
-----------------------
**2 NOTE :
If
clemson agrees our idea that CASIO suggested to Clemson by the e-mail
'some fundtionality for AP STAT', then CASIO can realize this
functionality.
-----------------------
** Operation Procedure **
One-way
ANOVA.gif
Two-way
ANOVA.gif
4. INTERVAL
Specification.
AP STAT has the following functionality under
INTR
menu.
|
Bottom menu
|
Second menu
|
Third menu
|
Functionality
|
|
INTR
|
Z
|
1-Smpl
|
1-Sample ZInterval
|
|
|
|
2-Smpl
|
2-Sample ZInterval
|
|
|
|
1-Prop
|
1-Proportional ZInterval
|
|
|
|
2-Prop
|
2-Proportional ZInterval
|
|
|
T
|
1-Smpl
|
1-Sample tInterval
|
|
|
|
2-Smpl
|
2-Sample tInterval
|
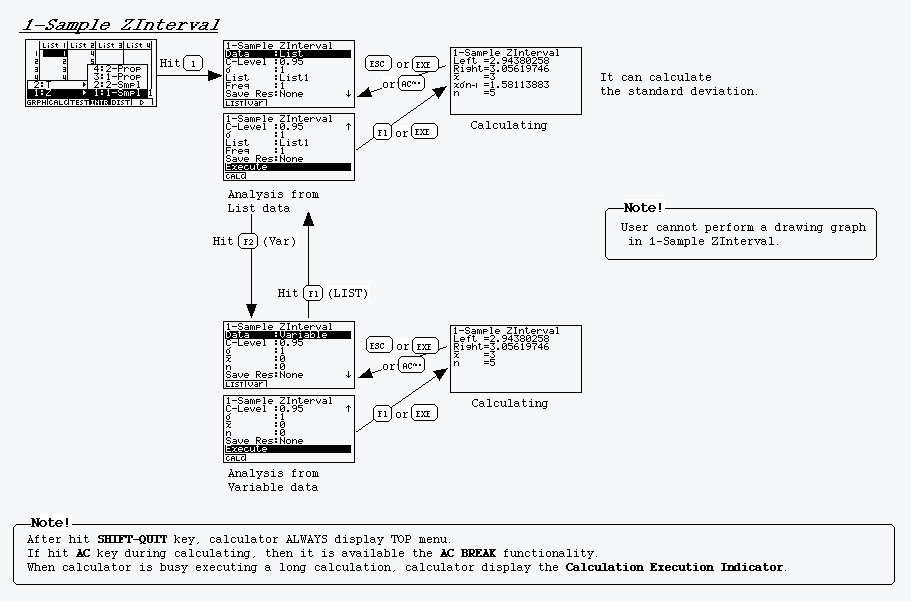
1-Sample
ZInterval
- User can choose list data or variable
data for input.
- When selected list into 'Data Type'
setting, the calculator has to compute sample mean and sample size
and standard deviation from list data before main calculating.
- Perform calculation (interval lower limit
(left edge), interval upper limit (right edge), sample mean,
sample standard deviation (only selected list into 'Data Type'
setting), sample size).
- Do not perform a drawing graph.
** Operation Procedure **
I-Sample
ZInterval.gif
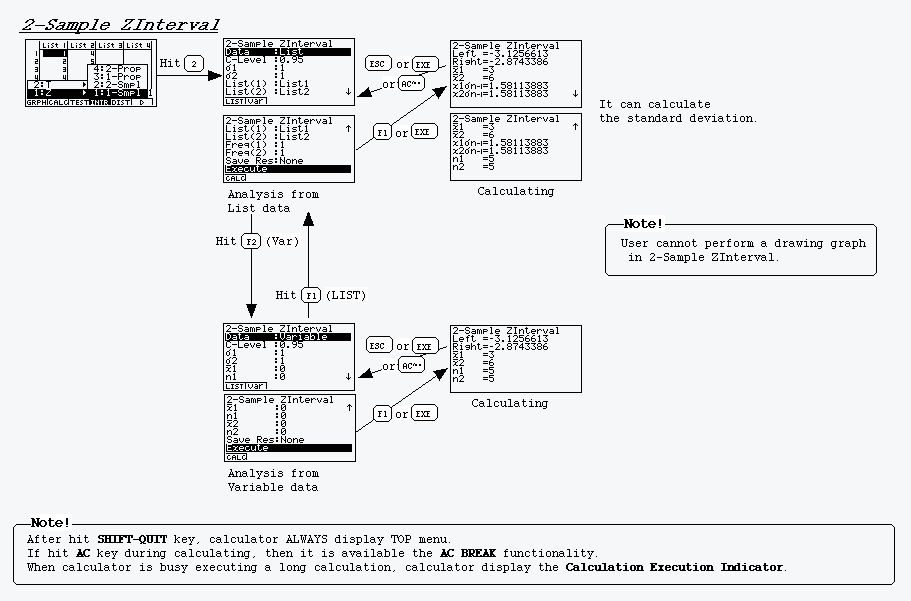
2-Sample
ZInterval
- User can choose list data or variable
data for input.
- When selected list into 'Data Type'
setting, the calculator has to compute sample mean and sample size
and standard deviation from list data (data1 and data2) before
main calculating.
- Perform calculation (interval lower limit
(left edge), interval upper limit (right edge), sample mean (data1
and data2), sample standard deviation (data1 and data2 / only
selected list into 'Data Type' setting), sample size (data1 and
data2)).
- Do not perform a drawing graph.
** Operation Procedure **
2-Sample
ZInterval.gif
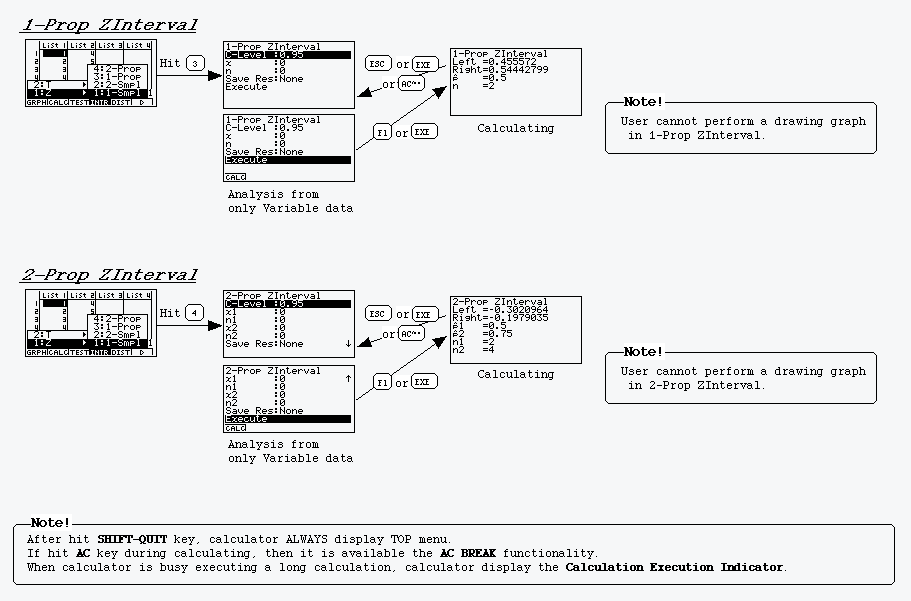
1-Proportional
ZInterval
- Variable data for input.
- Perform calculation (interval lower limit
(left edge), interval upper limit (right edge), expected p-value,
sample size).
- Do not perform a drawing graph.
** Operation Procedure **
1-Prop
ZInterval.gif
2-Proportional
ZInterval
- Variable data for input.
- Perform calculation (interval lower limit
(left edge), interval upper limit (right edge), expected p-value
(data1 and data2), sample size (data1 and data2)).
- Do not perform a drawing graph.
** Operation Procedure **
2-Prop
ZInterval.gif
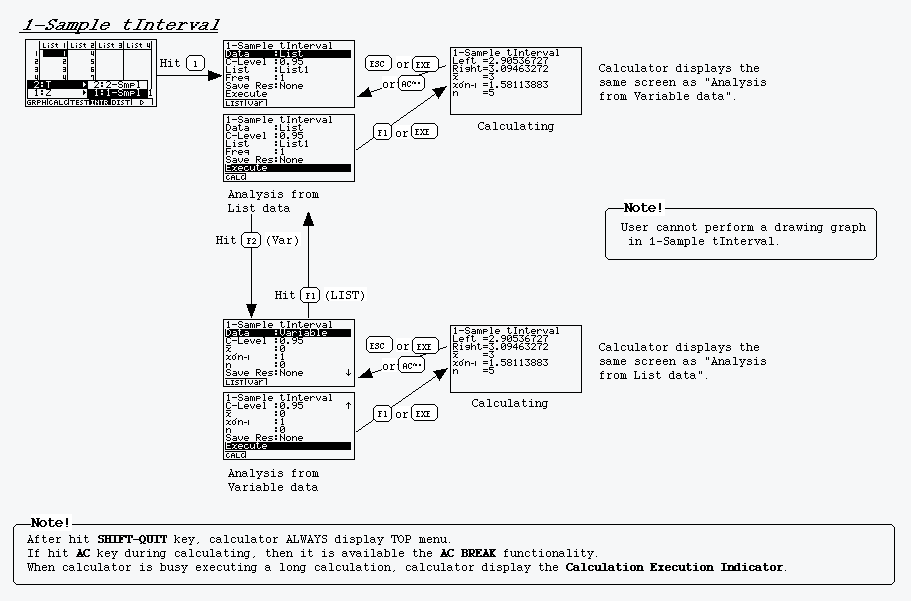
1-Sample
tInterval
- User can choose list data or variable
data for input.
- When selected list into 'Data Type'
setting, the calculator has to compute sample mean and sample size
and standard deviation from list data before main calculating.
- Perform calculation (interval lower limit
(left edge), interval upper limit (right edge), sample mean,
sample standard deviation, sample size).
- Do not perform a drawing graph.
** Operation Procedure **
1-Sample
tInterval.gif
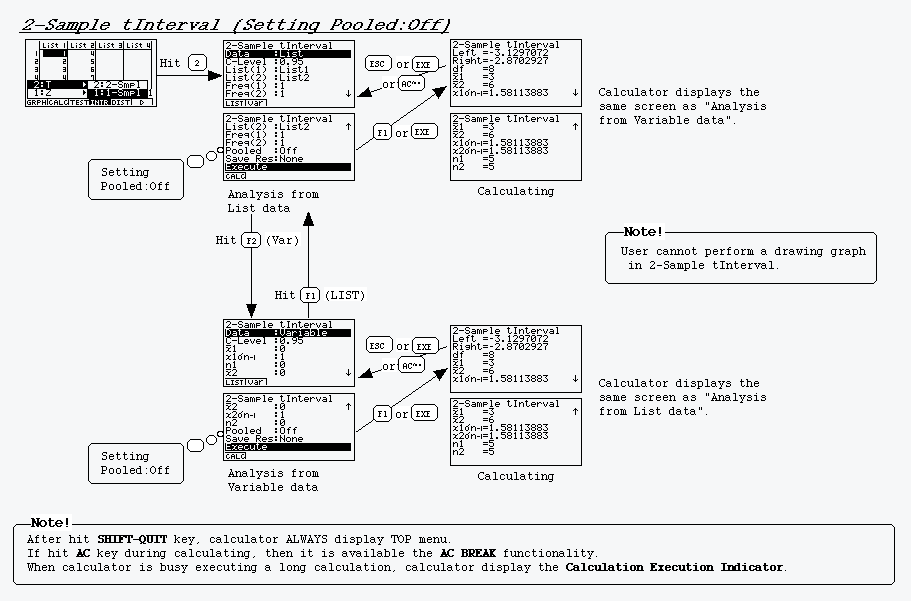
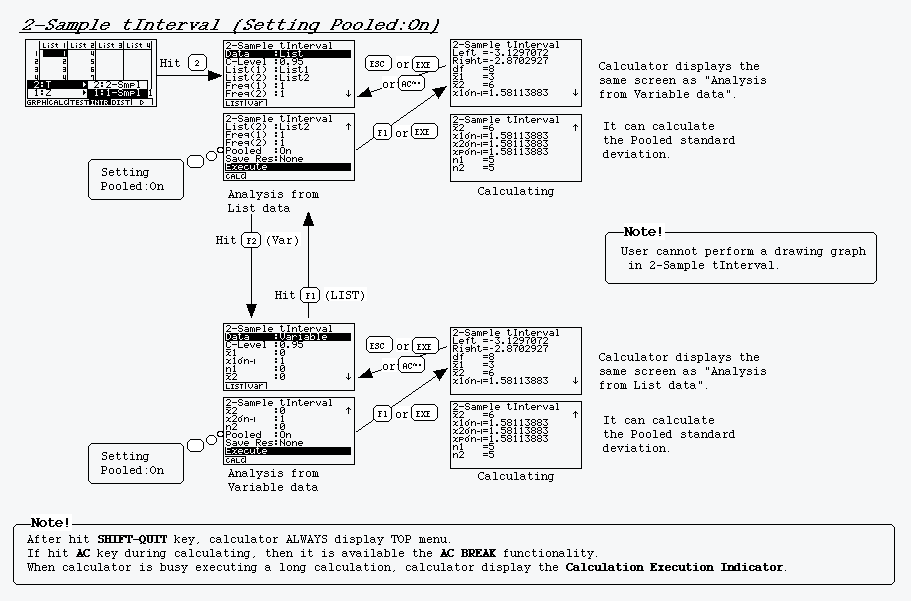
2-Sample
tInterval
- User can choose list data or variable
data for input.
- When selected list into 'Data Type'
setting, the calculator has to compute sample mean and sample size
and standard deviation from list data (data1 and data2) before
main calculating.
- Perform calculation (interval lower limit
(left edge), interval upper limit (right edge), degrees of
freedom, sample mean (data1 and data2), sample standard deviation
(data1 and data2), sample size (data1 and data2)).
- When selected pooled:on into 'pooled'
setting before user calculates, calculator has to compute in
executing and display a pooled sample standard deviation.
- Do not perform a drawing graph.
** Operation Procedure **
2-Sample
tInterval.gif
2-Sample
tInterval.gif
5. DISTRIBUTION
Specification.
AP STAT has the following functionality under
DIST
menu.
|
Bottom menu
|
Second menu
|
Third menu
|
Functionality
|
|
DIST
|
Norm
|
P.D
|
Normal Probability Density
|
|
|
|
C.D
|
Normal Distribution
Probability
|
|
|
|
Invrse
|
Inverse Cumulative Normal
Distribution
|
|
|
T
|
P.D
|
Student-t Probability Density
|
|
|
|
C.D
|
Student-t Distribution
Probability
|
|
|
X2
|
P.D
|
Chi-Square Probability
Density
|
|
|
|
C.D
|
Chi-Square Distribution
Probability
|
|
|
F
|
P.D
|
F Probability Density
|
|
|
|
C.D
|
F Distribution Probability
|
|
|
Binmal
|
P.D
|
Binomial Probability
|
|
|
|
C.D
|
Binomial Cumulative Density
|
|
|
Poissn
|
P.D
|
Poisson Probability
|
|
|
|
C.D
|
Poisson Cumulative Density
|
|
|
Geo
|
P.D
|
Geometric Probability
|
|
|
|
C.D
|
Geometric Cumulative Density
|
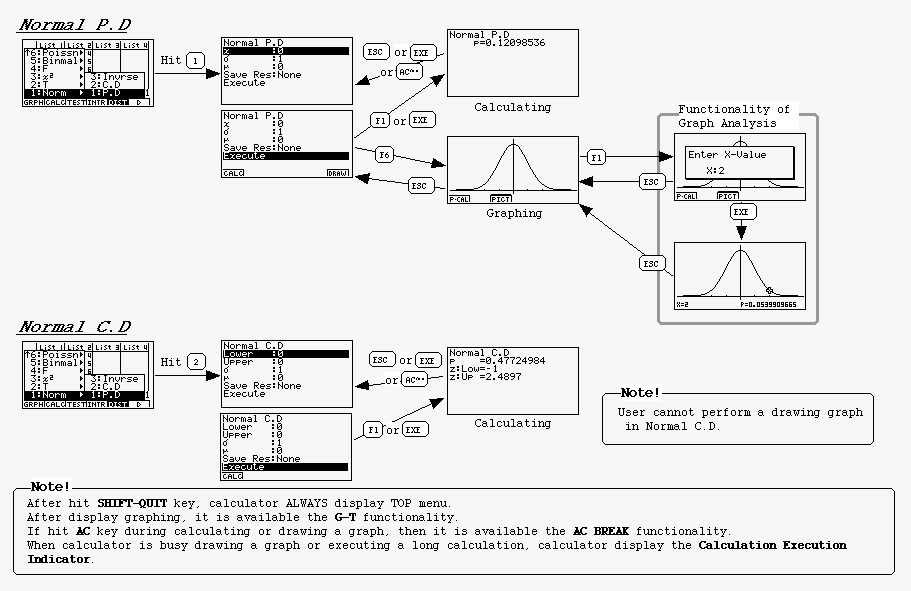
Normal Probability
Density
- Variable data for input.
- Perform calculation (Normal Probability
Density) or drawing a graph.
- Perform graph analysis (Normal
Probability Density).
** Operation Procedure **
N
P.D.gif
Normal Distribution
Probability
- Variable data for input.
- Perform calculation (Normal Distribution
Probability, z:Low
value, z:Up value).
- Do not perform a drawing graph.
** Operation Procedure **
N
C.D.gif
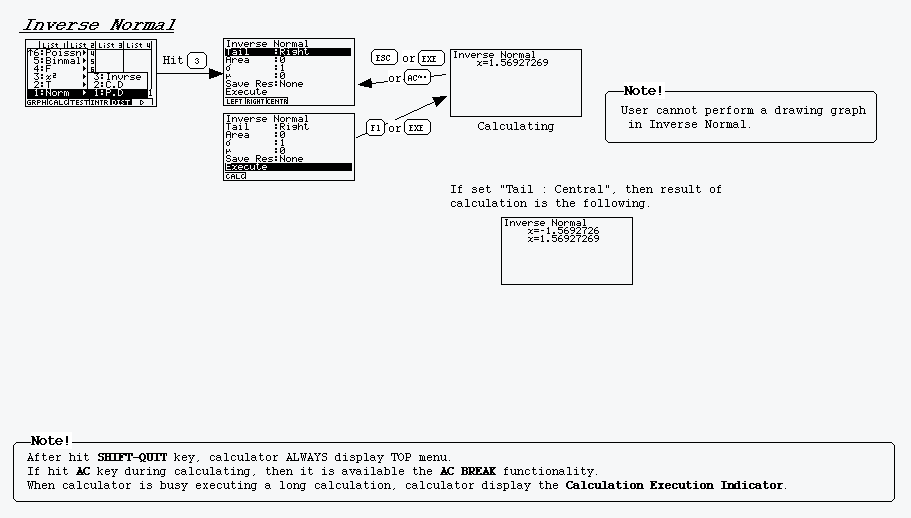
Inverse Cumulative Normal
Distribution
- Variable data for input.
- User can choose the tail
condition (left, right, central).
- Perform calculation (Inverse Cumulative
Normal Distribution (lower boundary of integration interval
(Tail:left), upper boundary of
integration interval (Tail:right), both boundary of integration
interval (Tail:Central)).
- Do not perform a drawing graph.
** Operation Procedure **
InvNorm.gif
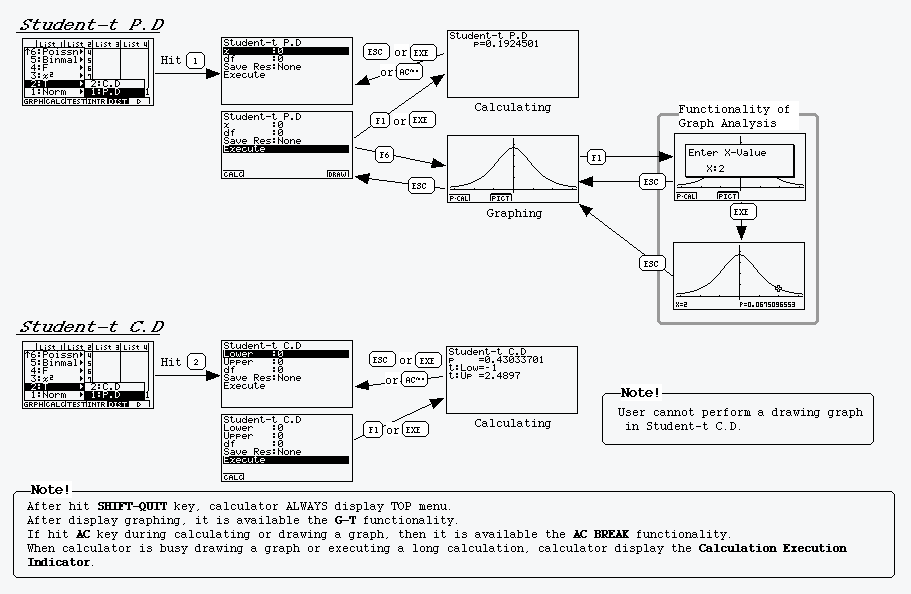
Student-t Probability
Density
- Variable data for input.
- Perform calculation (Student-t
Probability Density) or drawing a graph.
- Perform graph analysis (Student-t
Probability Density).
** Operation Procedure **
t
P.D.gif
Student-t Distribution
Probability
- Variable data for input.
- Perform calculation (Student-t
Distribution Probability, t:Low value, t:Up value).
- Do not perform a drawing graph.
** Operation Procedure **
t
C.D.gif
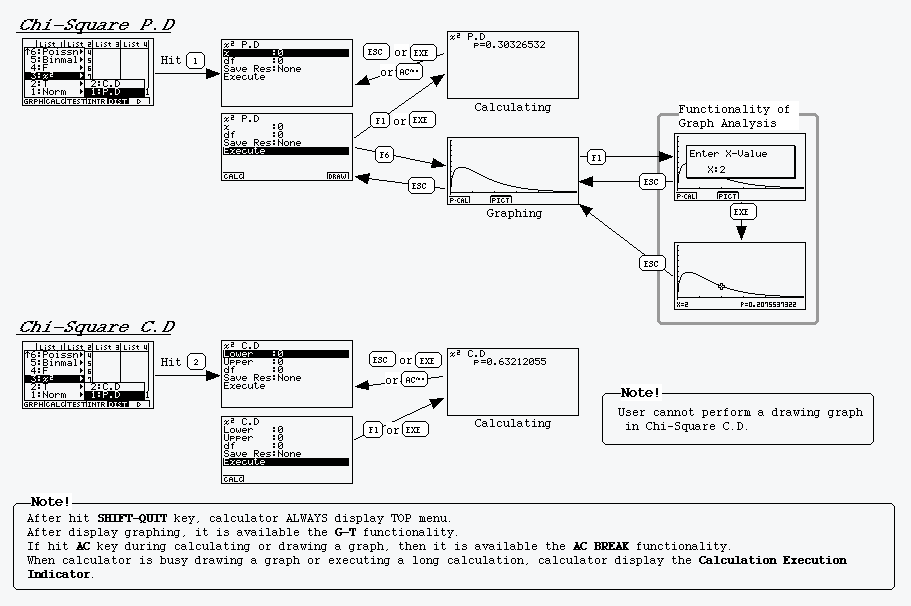
Chi-Square Probability
Density
- Variable data for input.
- Perform calculation (Chi-Square
Probability Density) or drawing a graph.
- Perform graph analysis (Chi-Square
Probability Density).
** Operation Procedure **
C
P.D.gif
Chi-Square Distribution
Probability
- Variable data for input.
- Perform calculation (Chi-Square
Distribution Probability).
- Do not perform a drawing graph.
** Operation Procedure **
C
C.D.gif
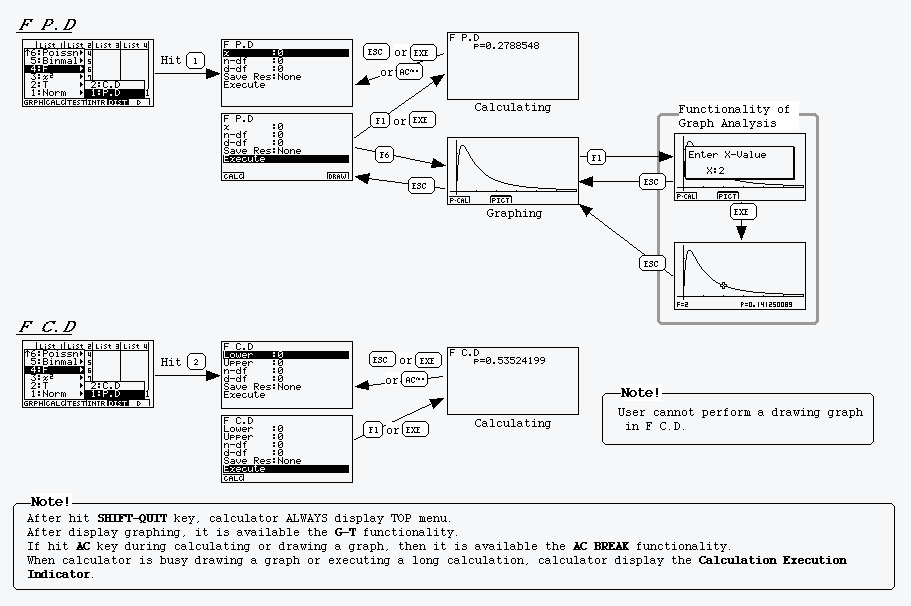
F Probability
Density
- Variable data for input.
- Perform calculation (F Probability
Density) or drawing a graph.
- Perform graph analysis (F Probability
Density).
** Operation Procedure **
F
P.D.gif
F Distribution
Probability
- Variable data for input.
- Perform calculation (F Distribution
Probability).
- Do not perform a drawing graph.
** Operation Procedure **
F
C.D.gif
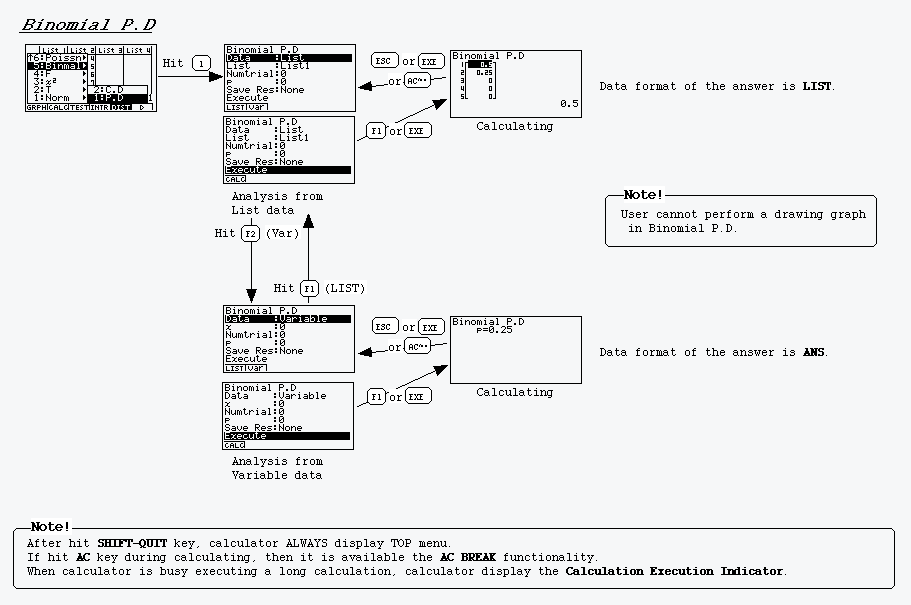
Binomial
Probability
- User can choose list data or variable
data for input.
- When selected list into 'Data Type'
setting, user can use list data that contents user wants to use as
sample data.
- Perform calculation (Binomial
Probability). If selected list, then calculator display the answer
that data format is LIST. If selected
variable, then calculator display the answer that data format is
ANS.
- Do not perform a drawing graph.
** Operation Procedure **
B
P.D.gif
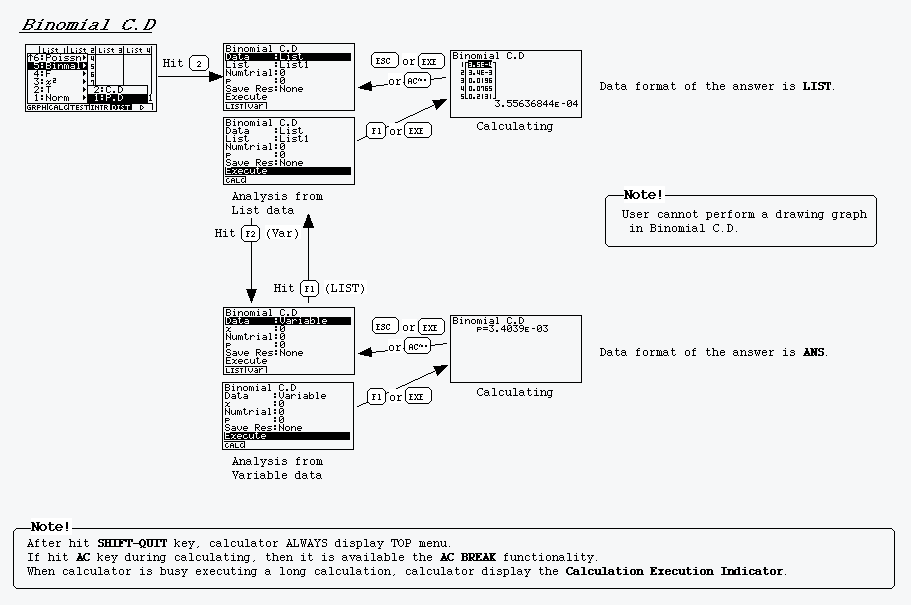
Binomial Cumulative
Density
- User can choose list data or variable
data for input.
- When selected list into 'Data Type'
setting, user can use list data that contents user wants to use as
sample data.
- Perform calculation (Binomial Cumulative
Density). If selected list, then calculator display the answer
that data format is LIST. If selected
variable, then calculator display the answer that data format is
ANS.
- Do not perform a drawing graph.
** Operation Procedure **
B
C.D.gif
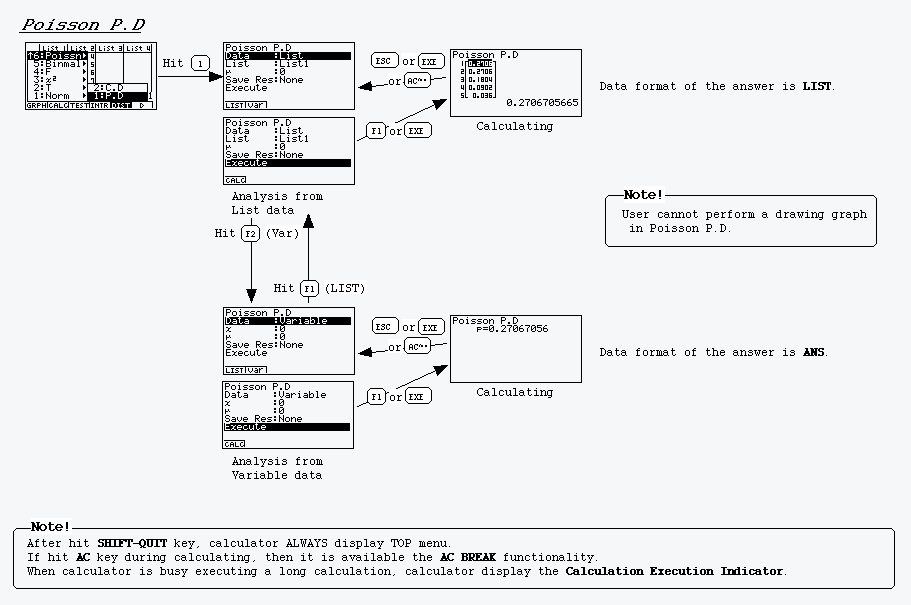
Poisson
Probability
- User can choose list data or variable
data for input.
- When selected list into 'Data Type'
setting, user can use list data that contents user wants to use as
sample data.
- Perform calculation (Poisson
Probability). If selected list, then calculator display the answer
that data format is LIST. If selected
variable, then calculator display the answer that data format is
ANS.
- Do not perform a drawing graph.
** Operation Procedure **
P
P.D.gif
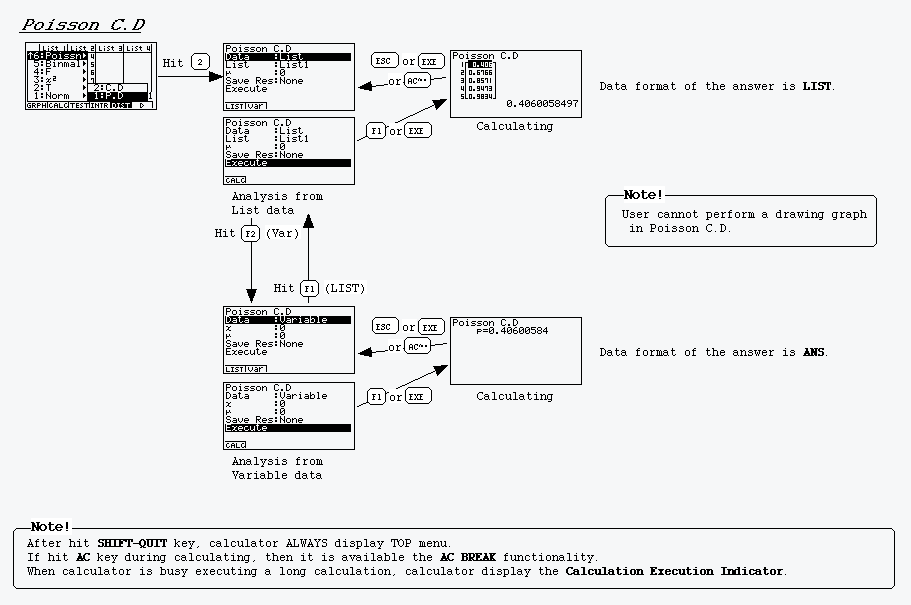
Poisson Cumulative
density
- User can choose list data or variable
data for input.
- When selected list into 'Data Type'
setting, user can use list data that contents user wants to use as
sample data.
- Perform calculation (Poisson Cumulative
density). If selected list, then calculator display the answer
that data format is LIST. If selected
variable, then calculator display the answer that data format is
ANS.
- Do not perform a drawing graph.
** Operation Procedure **
P
C.D.gif
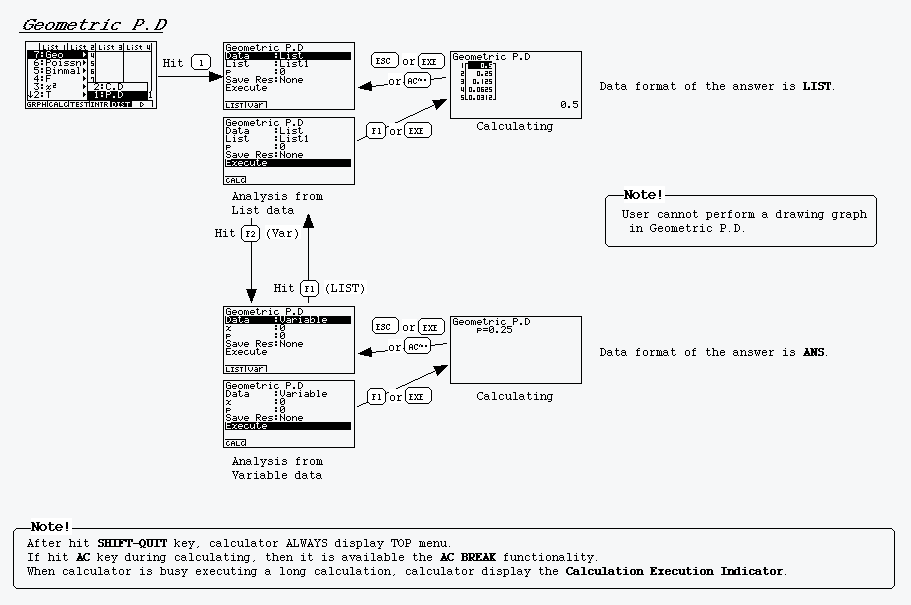
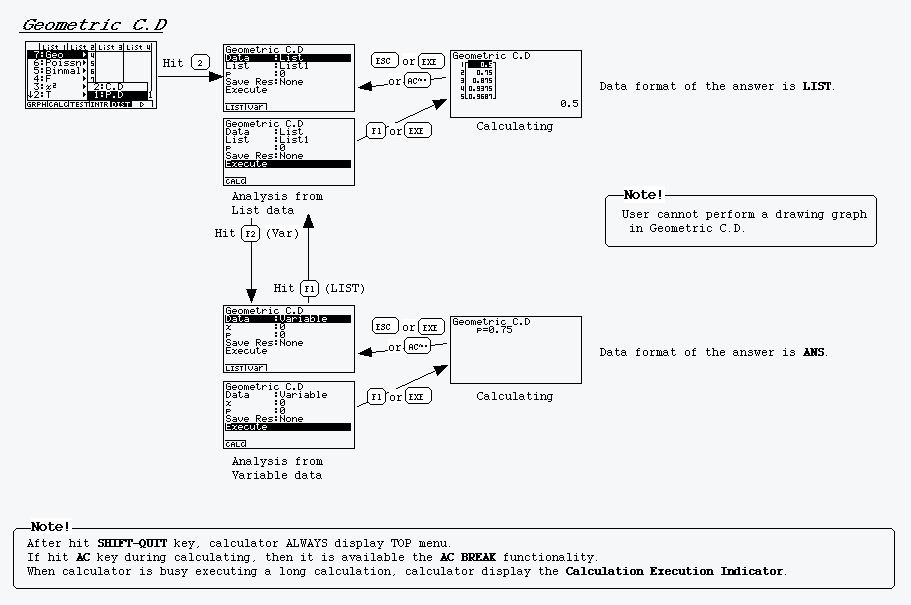
Geometric
Probability
- User can choose list data or variable
data for input.
- When selected list into 'Data Type'
setting, user can use list data that contents user wants to use as
sample data.
- Perform calculation (Geometric
Probability). If selected list, then calculator display the answer
that data format is LIST. If selected
variable, then calculator display the answer that data format is
ANS.
- Do not perform a drawing graph.
** Operation Procedure **
G
P.D.gif
Geometric Cumulative
Density
- User can choose list data or variable
data for input.
- When selected list into 'Data Type'
setting, user can use list data that contents user wants to use as
sample data.
- Perform calculation (Geometric Cumulative
Density). If selected list, then calculator display the answer
that data format is LIST. If selected
variable, then calculator display the answer that data format is
ANS.
- Do not perform a drawing graph.
** Operation Procedure **
G
C.D.gif
6. Additional
specification
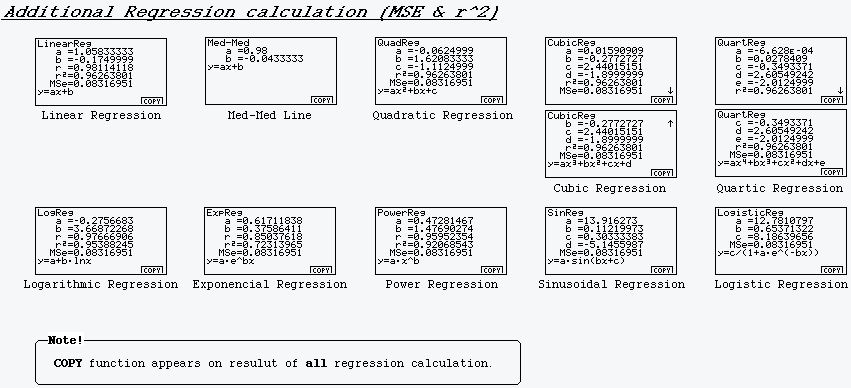
In AP STAT, we have a plan
that the calculator computes the mean square error (MSE) after (or
the same time) EVERY
regression calculation.
NOTE : This is ClemsonĹfs job (CASIO and
Clemson had agreed).
In AP STAT, we have a plan
that the calculator computes the coefficient of determination (r^2)
after (or the same time) the following regression calculation.
(a) Linear Regression (CASIO
had already realized in FX2.0)
(b) Quadratic
Regression
(c) Cubic Regression
(d) Quartile
Regression
(e) Logarithmic Regression
(CASIO had already realized in FX2.0)
(f) Exponential Regression
(CASIO had already realized in FX2.0)
(g) Power Regression
(CASIO had already realized in FX2.0)
So we have to develop (b),
(c), (d) functions for computing r^2.
NOTE : This is Clemson's job (CASIO and
Clemson had agreed).
** Operation Procedure **
MSE,
r^2.gif
estimated
value.gif