colormap(map)colormap('default')colormap(hsv)map = colormap
m-by-3 matrix of real numbers between 0.0 and 1.0. The k-th row of the colormap defines the k-th color by specifying the intensity of red, green and blue, i.e., map(k,:) = [r(k) g(k) b(k)]. For example, [0 0 0] is black, [1 1 1] is white, [1 0 0] is pure red, and [.5 1 .83] is aquamarine.
colormap(map) sets the colormap to the matrix map. If any values are outside the interval [0 1], an error message results.
colormap('default') and colormap(hsv) both set the current colormap to the default colormap, which varies the hue component in the hue-saturation-value color model.
map = colormap retrieves the current colormap. The values returned are in the interval [0 1].
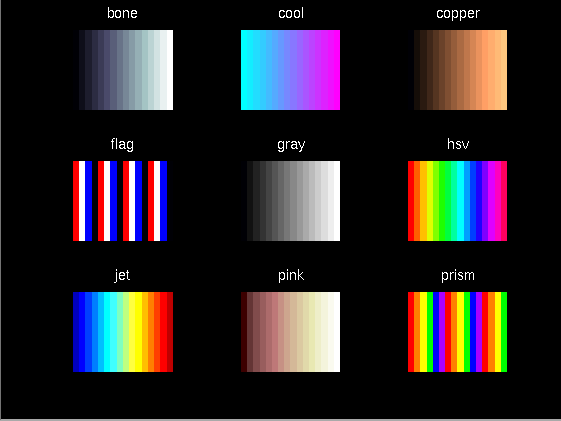
A number of other colormaps, including gray, hot, cool, copper, and pink, are generated by M-files in the color directory. The figure below shows some of the colormaps that MATLAB provides:
You can specify the size of the colormap created by these functions as an argument. The default is 64. For example, the statement
colormap(hot(128))
creates a length 128 colormap that ranges from black to white, passing through shades of red, orange, and yellow.
mesh, surf, pcolor, and others - map a color matrix, c, whose values are in the range k, in the range [1, m]. The values of cmin and cmax are either max(max(c)), or are specified by caxis. The mapping is linear, with cmin mapping to index 1 and cmax mapping to index m. The indices are then used with the colormap to determine the color associated with each matrix element. See caxis for details.
Each figure window has its own ColorMap property. colormap is a simple M-file that sets and gets this property.
imagedemo. Select Color Spiral from the menu (starts automatically on the Macintosh). This uses the pcolor function to display a 16-by-16 matrix whose elements vary from 0 to 255 in a rectilinear spiral. The default colormap, hsv, starts with red in the center, then passes through yellow, green, cyan, blue and magenta before returning to red at the outside end of the spiral. Selecting Colormap Menu gives access to a number of other colormaps (this is not true for the Macintosh).
The rgbplot function provides further information about colormaps. Try rgbplot(hsv), rgbplot(gray), rgbplot(hot), etc.
bone,cool,copper,flag,gray,hot,hsv,jet,pink,prism,whitebrighten,caxis,ColorSpec,image,mesh,pcolor,rgbplot,surfTheColorMapproperty of figure objects.


(c) Copyright 1994 by The MathWorks, Inc.