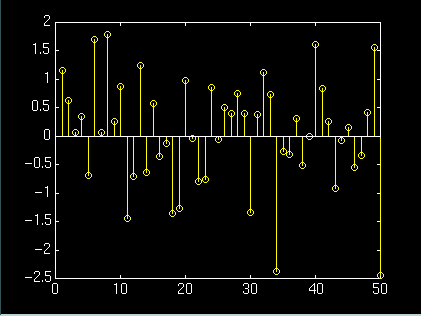
y = randn(50,1);
stem(y)

stem(y)stem(x,y)stem(y,'linetype')stem(x,y,'linetype')
stem(y) plots the data sequence y as stems from the x-axis. Each stem is terminated with a circle whose y-position represents the data value.
stem(x,y) plots the data sequence y at the values specified in x.
stem(y,'linetype') and stem(x,y,'linetype') specify a line type for the stems of the plot. See plot for valid linetypes.
y = randn(50,1);stem(y)
bar,plot,stairs


(c) Copyright 1994 by The MathWorks, Inc.