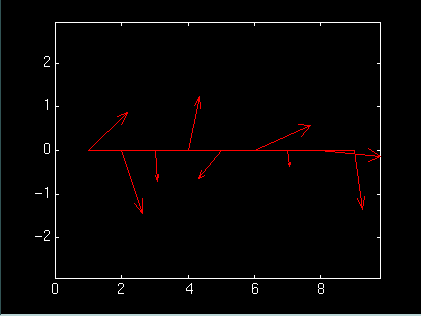
z = randn(3,3)+randn(3,3)*j;
feather(z)

feather(z)feather(x,y)
feather(z) draws a graph that displays the angle and magnitude of the complex elements of z as arrows emanating from equally spaced points along a horizontal axis.
feather(x,y) is equivalent to feather(x+yi). It displays the feather plot for the angles and magnitudes of the elements of matrices x and y.
z = randn(3,3)+randn(3,3)*j;feather(z)
compass,rose


(c) Copyright 1994 by The MathWorks, Inc.