plot(Y)plot(X,Y)plot(X,Y,'linetype')plot(X1,Y1,'linetype1',X2,Y2,'linetype2',...)h = plot(...)
plot(Y) plots the columns of Y versus their index. If Y is complex, plot(Y) is equivalent to plot(real(Y),imag(Y)). In all other uses of plot, the imaginary part is ignored.
plot(X,Y) plots vector X versus vector Y. If X or Y is a matrix, then the vector is plotted versus the rows or columns of the matrix, whichever line up.
Various line types, plot symbols and colors can be obtained with plot(X,Y,'linetype') where linetype is a 1-, 2-, or 3-character string made from the following characters:
---------------------------- . point y yellow o circle m magenta x x-markFor example,c cyan + plusr red * starg green - solid lineb blue : dotted linew white -. dashdot linek black - dashed line----------------------------
plot(X,Y,'c+') plots a cyan plus at each data point.
plot(X1,Y1,'linetype1',X2,Y2,'linetype2',...) combines the plots defined by the (X,Y,linetype1') triples, where the X's and Y's are vectors or matrices and the linetypes are strings.
For example, plot(X,Y,'-',X,Y,'go') plots the data twice, with a solid yellow line interpolating green circles at the data points.
The plot command, if no color is specified, makes automatic use of the colors in the above table. The default is yellow for one line, and for multiple lines, to cycle through the first six colors in the table.
h = plot(...) returns a column vector of handles to line objects, one handle per line. The line objects that plot creates are children of the current axes.
The X,Y pairs, or X, Y, linetype triples, can be followed by parameter value pairs to specify additional properties of the lines. See line for more information.
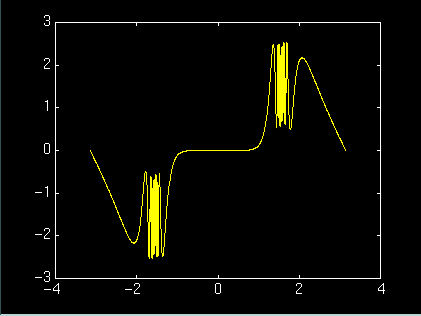
producex = -pi:pi/500:pi;y = tan(sin(x)) - sin(tan(x));plot(x,y)
axis,grid,hold,line,loglog,polar,semilogx,semilogy,subplot,title,xlabel,ylabel


(c) Copyright 1994 by The MathWorks, Inc.